Quick-Byte: Extract heap dump from JVM container
Problem
Your Java application shows unexpected behaviour during runtime, like using too much memory. To analyse the problem, you need to analyse the process.
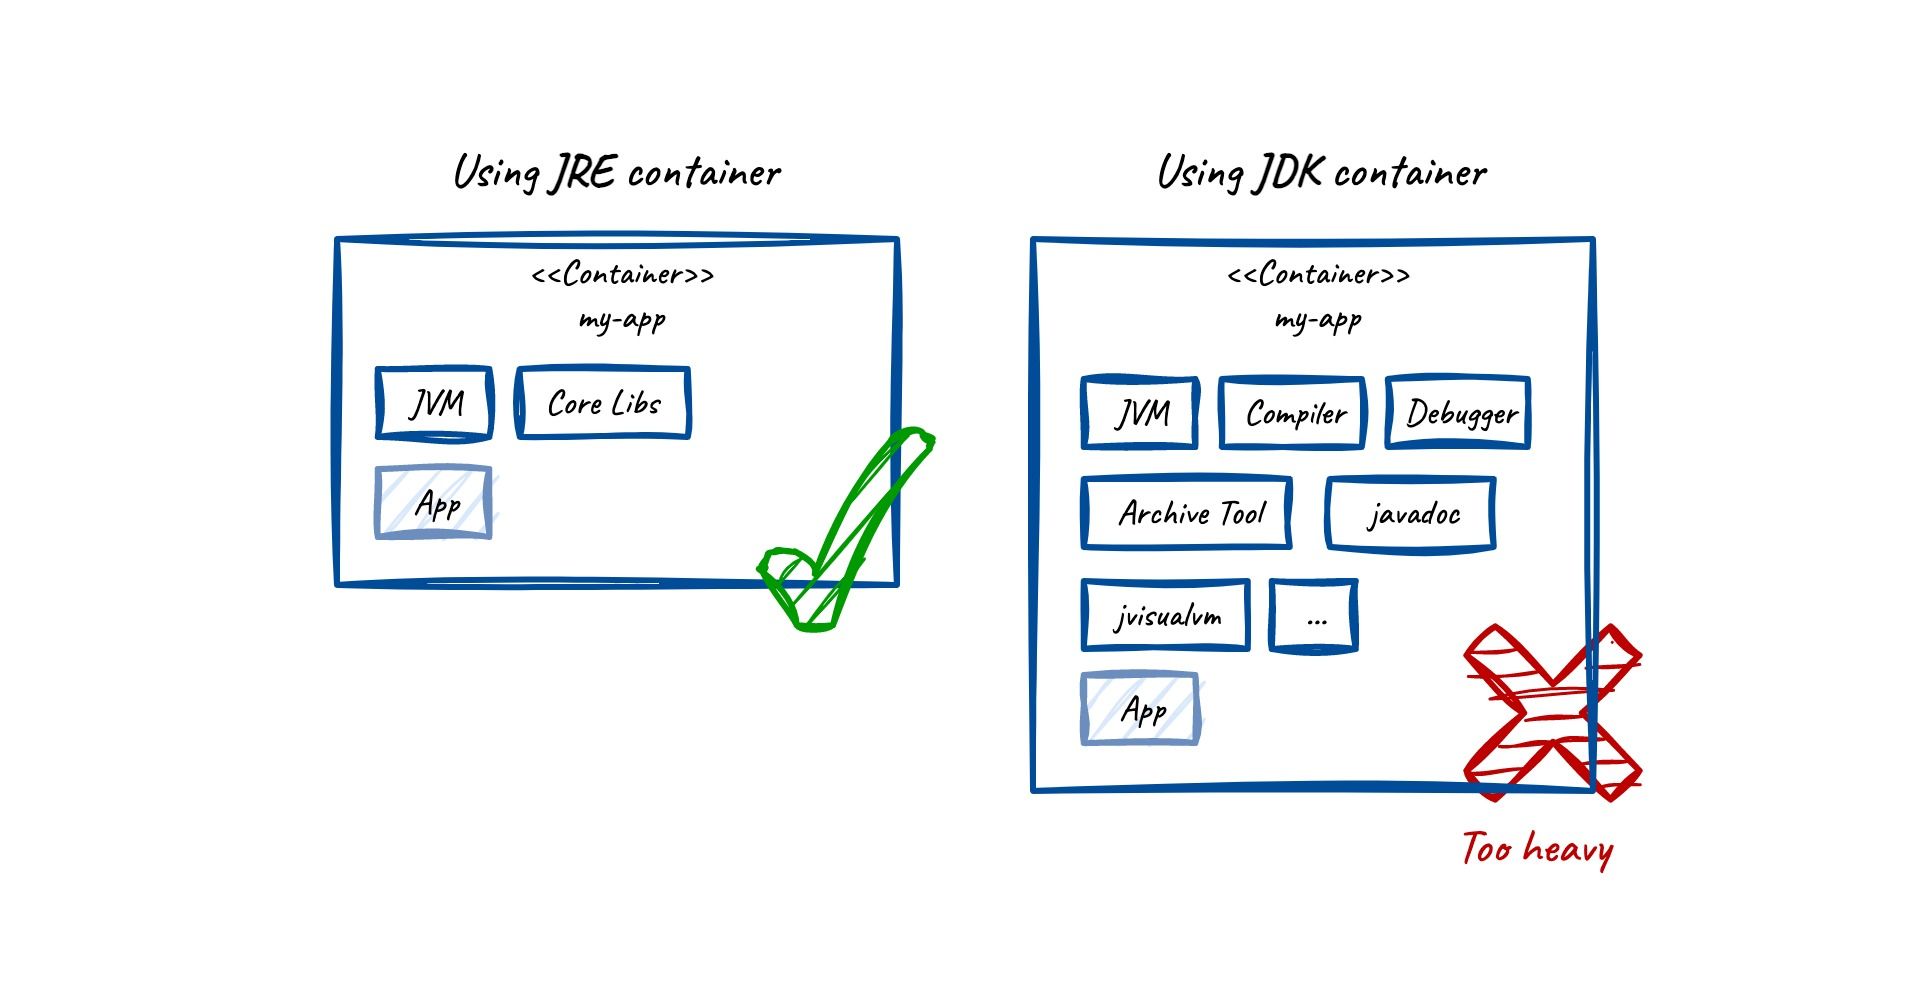
Best practice: Small container
To not use up unnecessary resources, it is recommended to use the JRE instead of the JDK in your image. The JDK includes tooling that you do not need during runtime. It bloats your image by another 100 MB+.
Spin up debugging container
So, assuming that there is no tooling because we follow the above best practice, we will need to bring our own toolbox 🧰. I will simply use a JDK container from Docker Hub that comes with the typical JDK tooling. Eclipse Temurin (Adoptium) provides these open-source images.
Run the following command to attach the debugging container to your running pod:
kubectl debug -it my_app_pod --image=eclipse-temurin:17.0.8_7-jdk -- bash
You will enter the container with a bash terminal.
Pitfall: java process not visible
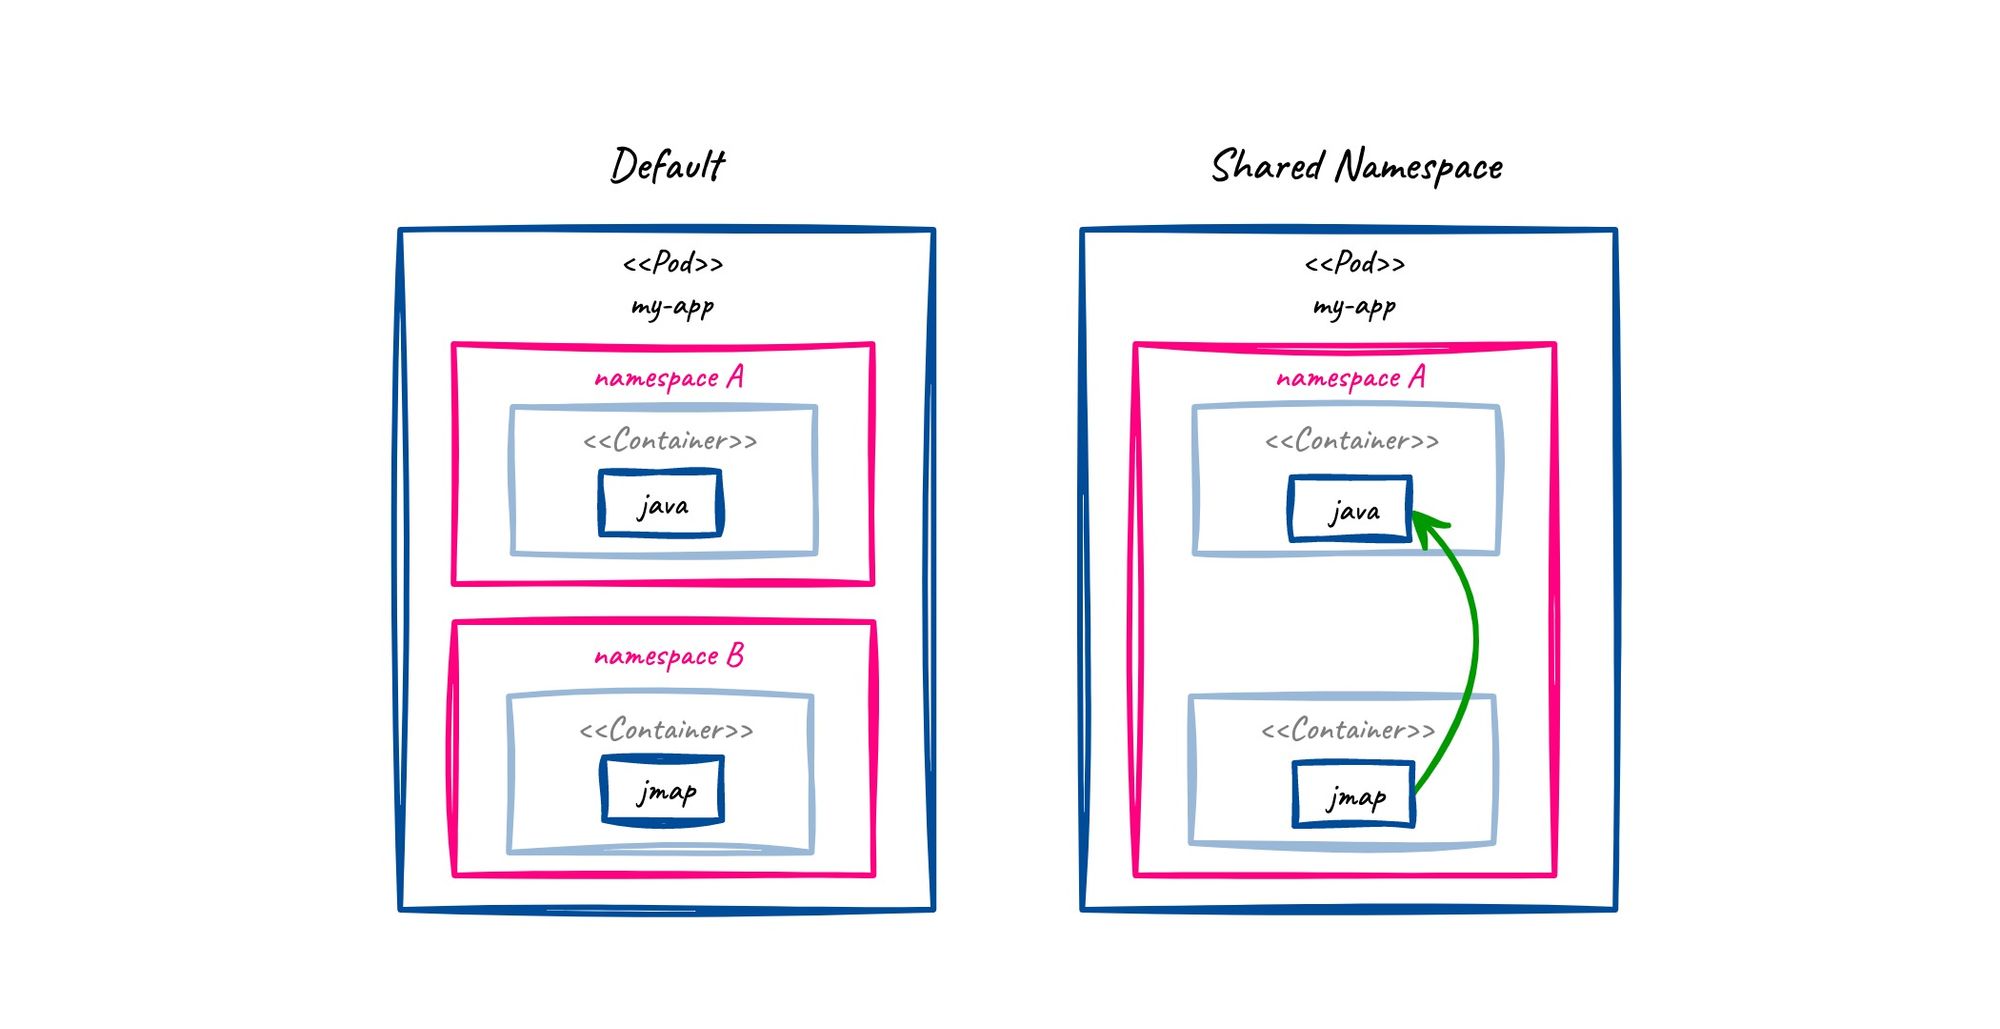
By default, containers do not share the processes with each other. This is a great zero-trust feature that the container engine provides via Linux namespaces and cgroups.
To debug another container, we need to share the processes between them. This can be achieved by adding the shareProcessNamespace setting to our deployment or pod file (an example here.) For troubleshooting, you can just edit the file within kubernetes (be cautious in prod environments, since the app restarts.)
The following picture summarises in a simplified way what happens when we have shared namespaces.
Create heap dump
Now, as usual, let’s create our heap dump:
- Get the app’s process ID (usually
1):
ps aux | grep java
- Generate heapdump file:
jmap -dump:live,format=b,file=/tmp/heap.hprof 1
- And copy the file to your machine to open it in your favourite tool:
kubectl cp <pod name>:/tmp/heap.hprof -c <container name> ./heap.hprof
Done! Now you have your heap dump file on your local machine.