Quick Byte: Troubleshoot container connection issues
Problem: Failing connections
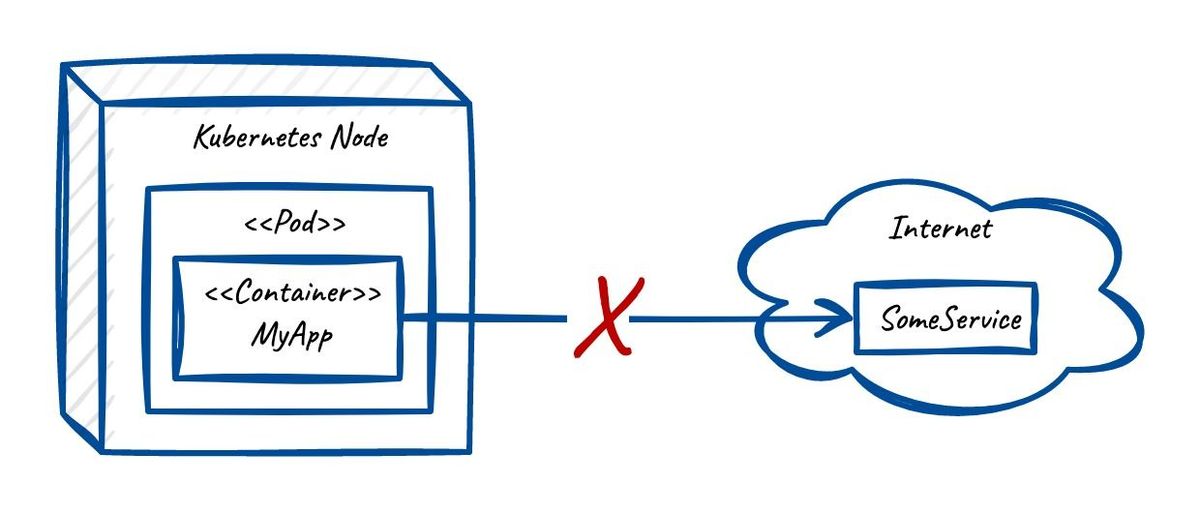
An application gets stuck because it “fails to connect” to an upstream service. The error logging should yield a detailed message on what is going wrong. If this is not the case and a code change with app deployment takes too long, it is usually a practical option to go do a basic check yourself.
Here, we will test if your container can reach a given URL. Still, remember that good error handling and logging can save you this effort.
Requirements
- Very basic understanding of UNIX commands
- Know how to log on to your container in kubernetes (k8s)
Analysis
After you have logged on to your k8s container, get a copy of the URL that you want to test. Now what we can do is simply curl the address to see whether it is reachable from the container:
curl -i https://www.google.com
The -i parameter includes the response headers in the output. The first line will give you the status code. It will look something like the following:
~ % curl -i https://www.google.com
HTTP/2 200
date: Mon, 27 Jul 2023 09:41:45 GMT
...
Now you know whether the connection to the destination can be established or not.
⚠️ Pitfall: “command not found”
Or maybe you just see something like
command not found: curl
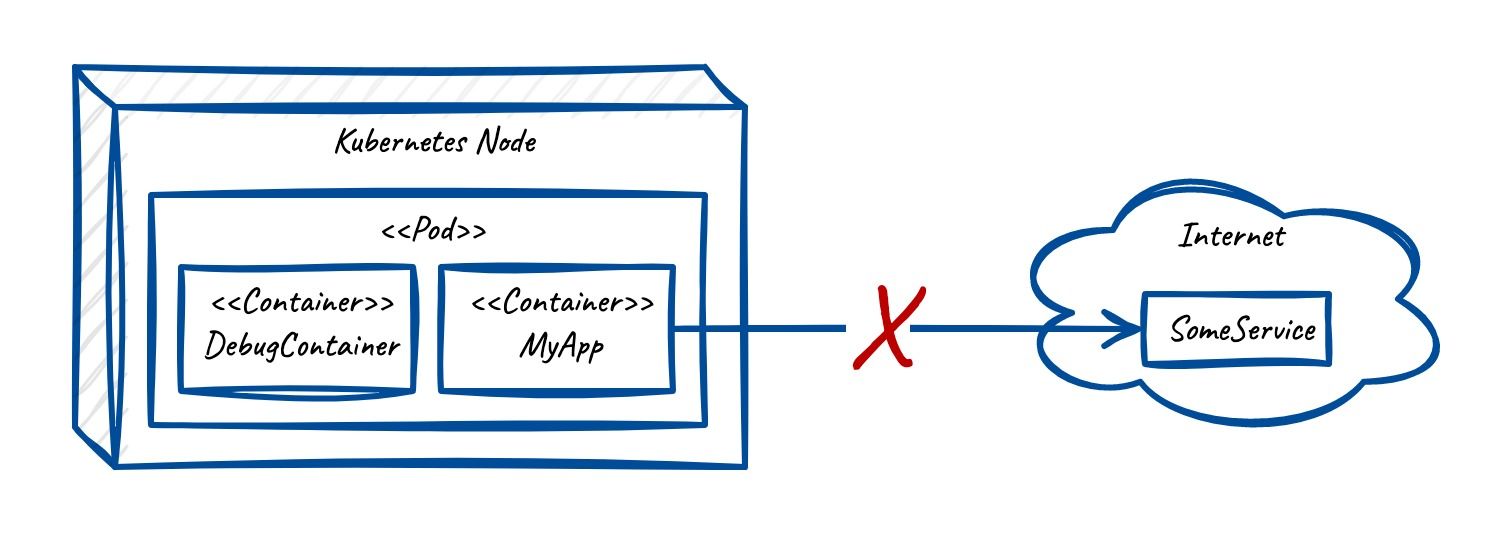
This means that you are probably operating on a stripped down version of an operating system (like for example Alpine Linux.) You have two options now:
- Install curl (not recommended)
- Use
kubectl debuginstead ofkubectl exec(recommended)
We are not going down the road of installing curl because this is more of a workaround than a solution. So let’s use kubcetl debug.
Using kubectl debug 🛠️
This allows you to use a separate temporary container that can access information on your app container (through shared network and process namespaces). The cool thing is that this container can run on richer image with your preferred tooling.
Just run the following command:
~ $ kubectl debug -it my_app_pod --image=lightruncom/koolkits:jvm --target=my_app_container
This will spin up a container within the pod that runs on a koolkits debugging image for the JVM – and start a terminal session within it that you can use.
More Docker images
Here are some more images that one should get familiar with: